Metrics
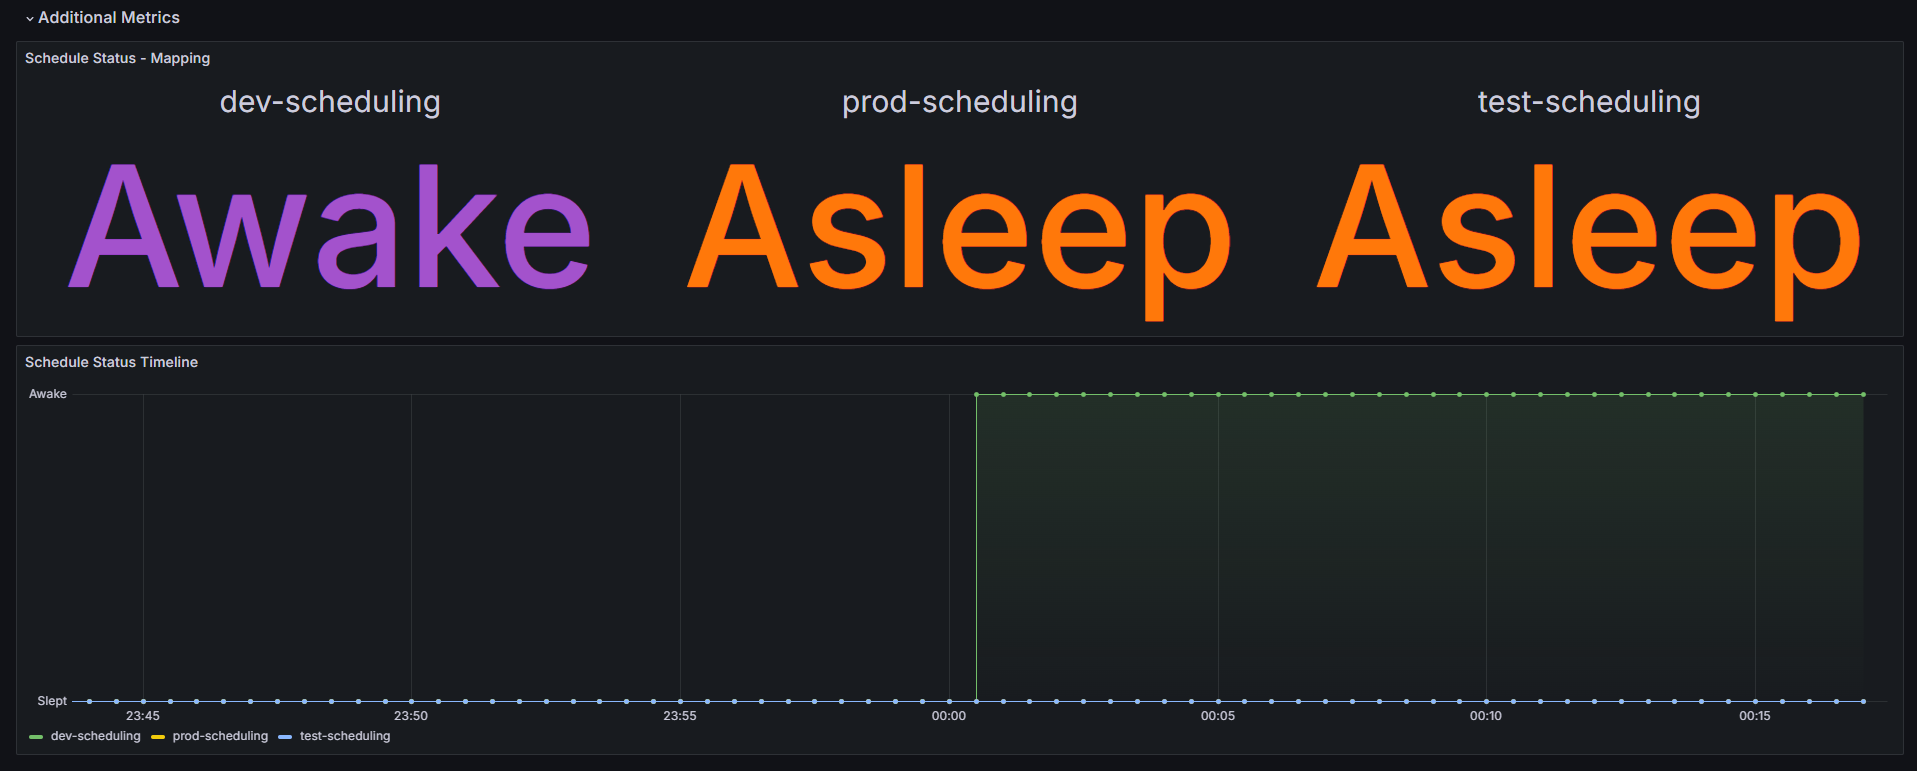
The screenshots of the metrics visualizations provided in this documentation are taken from Kronos' own Grafana dashboard, KronosBoard. If you want a powerful and user-friendly way to manage and monitor your Kronos deployment, we highly recommend visiting and using KronosBoard.
Default Controller Metrics
Controller Runtime, a part of the Kubebuilder framework, exports several default metrics that offer insights into the performance and behavior of controllers. Examples:
- process_cpu_seconds_total
- process_resident_memory_bytes

These metrics offer valuable information for monitoring and optimizing controller performance. For a comprehensive list of default metrics and their descriptions, refer to the official metrics reference page: Kubebuilder Metrics Reference.
Exposing Additional Prometheus Metrics
Kronos Operator exposes additional Prometheus metrics at path /metrics and port 8443. These metrics are crucial for monitoring the scheduling status of Kronos Custom Resources (CRs). Currently, the operator provides a single metric, schedule_info, which gives detailed information about the scheduling status of each individual Kronos CR.
To scrape these metrics, it is recommended to configure Prometheus either directly or using the ServiceMonitor Custom Resource Definition (CRD) managed by the Prometheus Operator. By scraping these metrics, operators and administrators can gain valuable insights into the scheduling behavior of Kronos CRs.
Metric Example
Schedule Info
| Name | Type | Example | Value |
|---|---|---|---|
| schedule_info | Gauge | kronos_schedule_info{name ="<crd-name>", namespace ="<crd-namespace>"} | 0:Asleep 1:Awake |

Indepth Schedule Info
| Name | Type | Example | Value |
|---|---|---|---|
| indepth_schedule_info | Gauge | kronos_indepth_schedule_info{name ="<crd-name>", namespace ="<crd-namespace>", status="", reason="", handled_resources="", next_operation=""} | 0:Asleep 1:Awake |

The kronos_indepth_schedule_info metric provides detailed information about the status and operations of a KronosApp Custom Resource (CR) in your Kubernetes cluster. Here’s an explanation of its fields:
Fields Breakdown
-
name
- Description: The name of the
KronosAppCR. - Example:
"prod-scheduling"
- Description: The name of the
-
namespace
- Description: The namespace in which the
KronosAppCR is located. - Example:
"default"
- Description: The namespace in which the
-
status
- Description: The current status of the
KronosAppCR. - Possible Values:
"Awake": The resource is currently active."Asleep": The resource is currently inactive or in sleep mode.
- Description: The current status of the
-
reason
- Description: The reason or method for the current status of the
KronosAppCR. This field provides context on why the resource is in its current state. - Possible Values:
- For
Asleepstatus:"scheduled": The resource is asleep according to a pre-defined schedule."forceSleep": The resource was forced into sleep mode, overriding the regular schedule."holiday": The resource is asleep due to a holiday schedule.
- For
Awakestatus:"scheduled": The resource is awake according to a pre-defined schedule."forceWake": The resource was forced to wake up, overriding the regular schedule.
- For
- Description: The reason or method for the current status of the
-
handled_resources
- Description: Information about the resources managed by this
KronosAppCR. This could include details such as the number of pods, deployments, or other Kubernetes resources being handled. - Example:
"20"
- Description: Information about the resources managed by this
-
next_operation
- Description: The next scheduled operation or action that the
KronosAppCR will perform. This could indicate the next time the resource will wake up or go to sleep. - Example:
"2024-05-20T12:00:00Z"(indicating the next scheduled time for an operation)
- Description: The next scheduled operation or action that the
To ensure smooth integration and avoid conflicts with metrics from other operators, we strongly recommend prefixing (e.g. kronos_) both default and additional metrics generated by Kronos. This practice helps maintain metric uniqueness and clarity within your Prometheus instance.